
Dashboard & Reports
Beauty Salon Reporting and Dashboard
Numbers tell how a business is doing more honestly than feelings do. The dashboard shows today, and the reports show the period and the team.
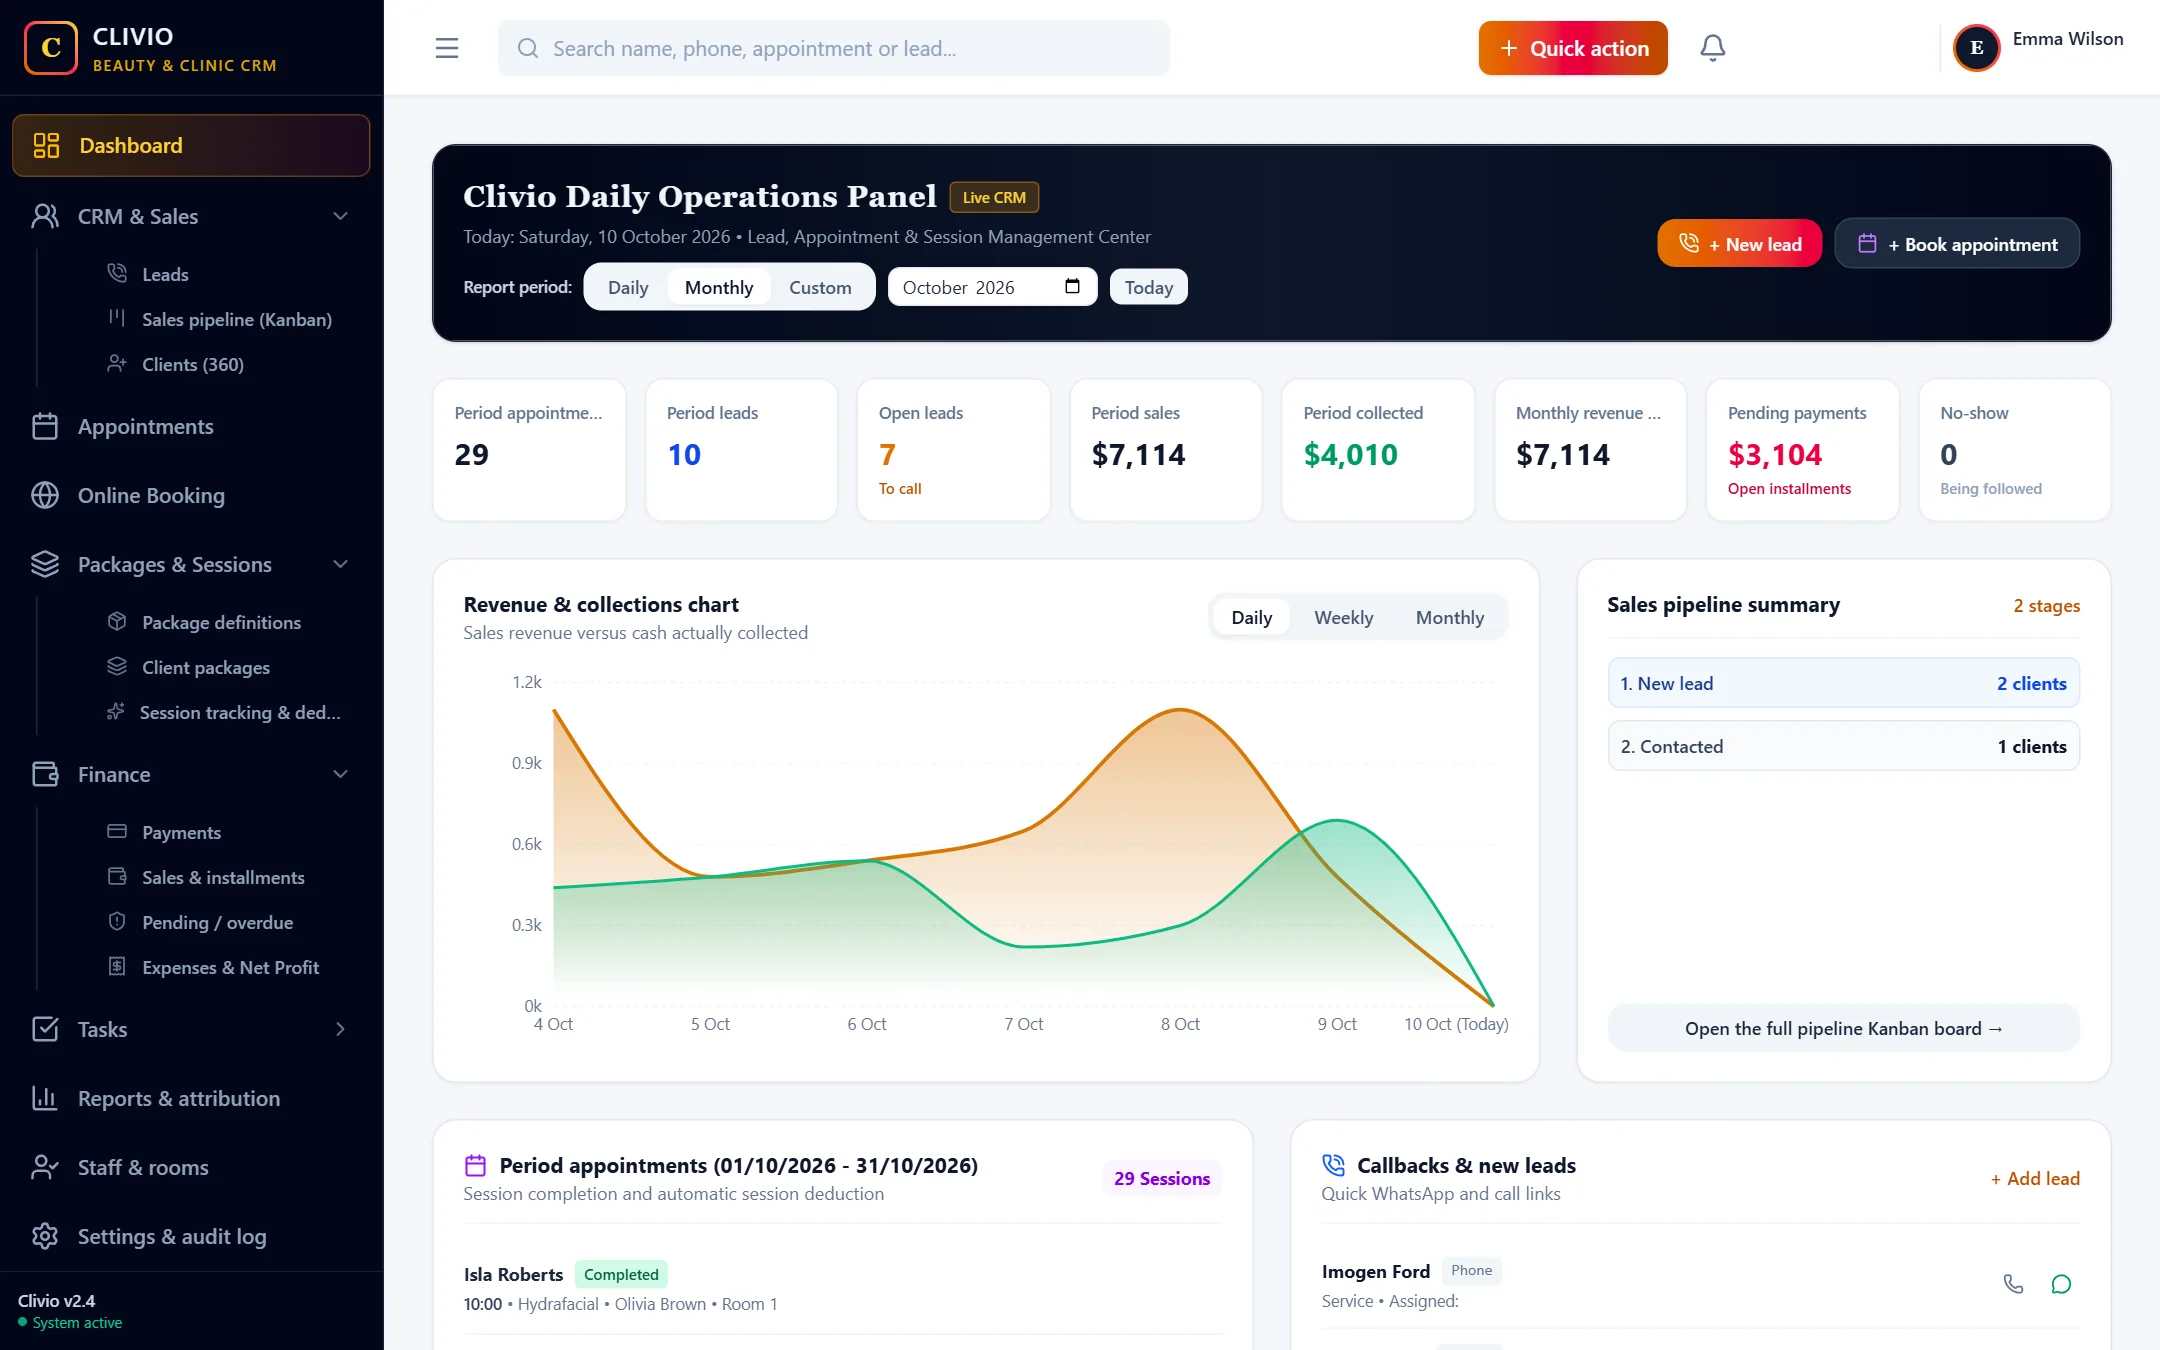
What does it offer?
- Daily, monthly or custom date range selection
- Appointments, leads, sales, payments, pending receivables and no-show count
- Revenue and collection chart, best-selling services and packages
- Staff performance and occupancy rate
- Daily cash close and conversion funnel
- Expense entry and net profit per period (collected - expenses)
Dashboard: today's summary
The dashboard gives you today's appointments, incoming and pending leads, sales, payments, pending receivables and the number of no-show clients at a glance. You can change the period to daily, monthly or a custom range. The revenue and collection chart lets you see the difference between what was sold and what came into the till.
Staff performance
For the period you choose, the number of sales, revenue generated, completed sessions and no-show appointments are listed for each staff member. Revenue is credited to the consultant the client is assigned to, not to the person who entered the sale; so real effort is reflected in the right place.
Occupancy rate
The occupancy rate is the ratio of booked appointment time to the staff member's working hours. Cancelled and no-show appointments are not counted as booked. You see it by staff member and by day; you know which day and which person has gaps, and you aim your campaign there.
Daily cash close
At the end of the day you see the amounts received as cash, card and transfer per day and compare them with the physical amount in your till. Voided payments are not included in the total but are shown separately. You can download the result as CSV.
Expense tracking and net profit
You enter rent, salary, supplies, bills, advertising, tax and equipment expenses with their category. The Expenses & Net Profit page compares the amount collected in the period you choose (excluding voided payments) with expenses and shows the net profit, the profit margin, a chart of the last 6 months and which category the money goes to. You can copy expenses that are the same every month from the previous month in one click and download the list as CSV. The calculation is cash-based: sales that have not been collected yet are not counted as profit.
Conversion funnel and channel performance
The numbers of incoming leads, contacted, appointment made, attended and converted to a sale are shown step by step. In the channel table, each ad source has its leads, number won and conversion percentage.
Make your decisions with data
Start Your 7-Day Free TrialFrequently Asked Questions
About Dashboard & Reports
Related features
Take your business digital today
Try it free for 7 days. No setup fee, no credit card needed.